Dashboards are a great tool for finance and business intelligence. In this course you will learn to create Learn to create powerful and attractive dashboards in Microsoft Excel and Power BI that are dynamic and easy to use.
Course objectives
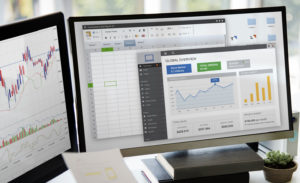
Making beautiful and dynamic dashboards can truly differentiate someone in finance or accounting! Dashboards are often used to provide information, insights, and analysis across all businesses. These are powerful tools! In this course we will teach you to create your own amazing dashboards in Excel and Microsoft Power BI.
We will start with the fundamentals of building a dashboard in Microsoft Excel. After that we will level-up by teaching you Power BI. If you aren’t familiar Power BI is a very useful Microsfot tool that helps you make dynamic dashboards for you or your company. By the end of this courses, you will be a dashboard ninja in both Excel and Power BI.
Some key things you’ll learn:
- The components of a great dashboard
- Visualizations and how/when to use them
- Create your own fully dynamic dashboard
- The basics of Microsoft Power BI
- Gain insights in your data with Power BI
We recommend taking our Intro to Data Analytics to supplement this course. This course gets you on the right path to truly understand your data.
Additional Info
Format: 3-6 minute videos, quizzes, and a final exam
Field of study: Financial Tools & Software
Prerequisites: You should have a solid working knowledge of Excel (things like: SUMIF, VLOOKUP, COUNTIFS, etc.). If you don’t feel comfortable with those type of excel skills, first take our Microsoft Excel Bootcamp.